Feature
The data health panel
See every event Feasible dropped in the last 24 hours, and why.
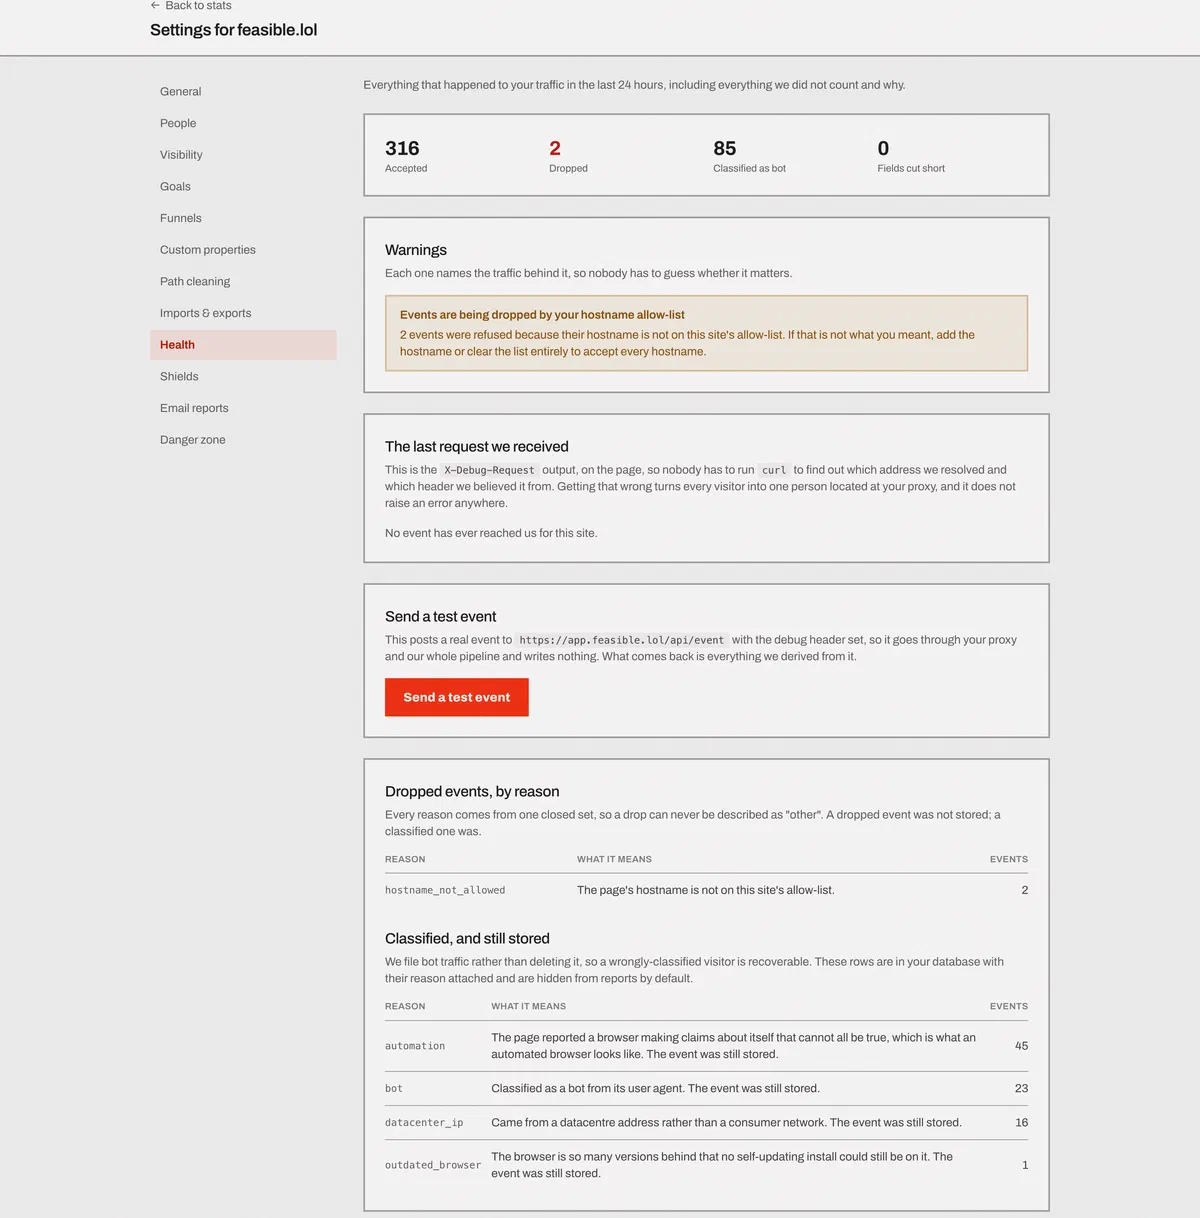
The health panel shows accepted, dropped, bot, and shortened events from the
last 24 hours. Every drop has a reason, such as bot, datacenter_ip,
unknown_site, hostname_not_allowed, shield_page, or invalid_payload.
There’s no miscellaneous bucket.
The last request we received
The panel prints the most recent request in full: the client IP we resolved, which header we believed it from, whether trusted proxies are configured, the hostname, the path, the tracker version, the user agent, and what we did with it.
That second one is the whole game. If your reverse proxy isn’t forwarding the visitor’s address, every visitor collapses into one person located at your datacenter - and nothing anywhere raises an error. Your dashboard keeps working. The numbers are just wrong, in a way that looks plausible for months.
So there’s a warning for it. When more than half of at least twenty requests resolve straight from the socket rather than a forwarded header, the panel says so in plain words. There’s a second warning when your pages are still running an old version of the tracking script.
Send a test event
The button posts a real event to the real public endpoint, through your proxy, through the whole pipeline, with a debug header set - so it returns everything we derived from it and writes nothing.
The design detail that makes it worth anything: it goes out over the public URL like a browser would, rather than calling an internal function and reporting success. A self-test that skips your proxy, your DNS and your headers is a test of the parts that were never broken.
If events are arriving from a hostname you haven’t allowed - a staging copy, somebody else’s page running your snippet - the panel names the hostname and offers a one-click button to allow it. An empty allow-list accepts everything, which is what almost every site wants; the first hostname you add brings your own domain along with it, so turning it on can’t accidentally switch you off.
Why this exists at all
Because the characteristic failure of web analytics isn’t an error. It’s a number that’s quietly wrong.
The script is on the page. Requests return 200. The dashboard renders. And your pageviews are down 40% because a deploy dropped the tag from one template, or a content security policy started blocking the endpoint, or a tag manager reorganized itself, or your CDN began caching the page for logged-in users. None of that raises an exception anywhere. You find out weeks later, when a number you’ve been reporting to somebody stops making sense.
The stated rule in this codebase is never fail silently - every dropped event, every truncated field, every failed job has to be visible to the customer or to us. The health panel is that rule with a URL.
It’s why a rejected event still returns a 202 with the reason in a response header instead of a bare
error, why the ingest endpoint’s 400 responses name what was missing,
and why sending a 31st custom property increments
a counter you can see rather than disappearing.
We don’t know of another tool in this category that ships this screen. Every
analytics product has this failure mode; most of them handle it with a support
email and a suggestion to open devtools. Building the panel is more work than
writing a troubleshooting doc, and it’s the difference between “your numbers
look off” and “five events came from preview-42.build-preview.example, here’s
the button.”
Related: excluding traffic explains the
shield_* reasons, and installation covers what to check
when nothing arrives at all.
The trade-off
The panel covers the last 24 hours. It’s a debugging surface, not a history - if something went wrong last Tuesday and fixed itself, the panel won’t tell you about it. Evidence about rejected hostnames is the one exception; that’s kept for 30 days.