Feature
Reports and alerts
Send the numbers to the people who are never going to open a dashboard.
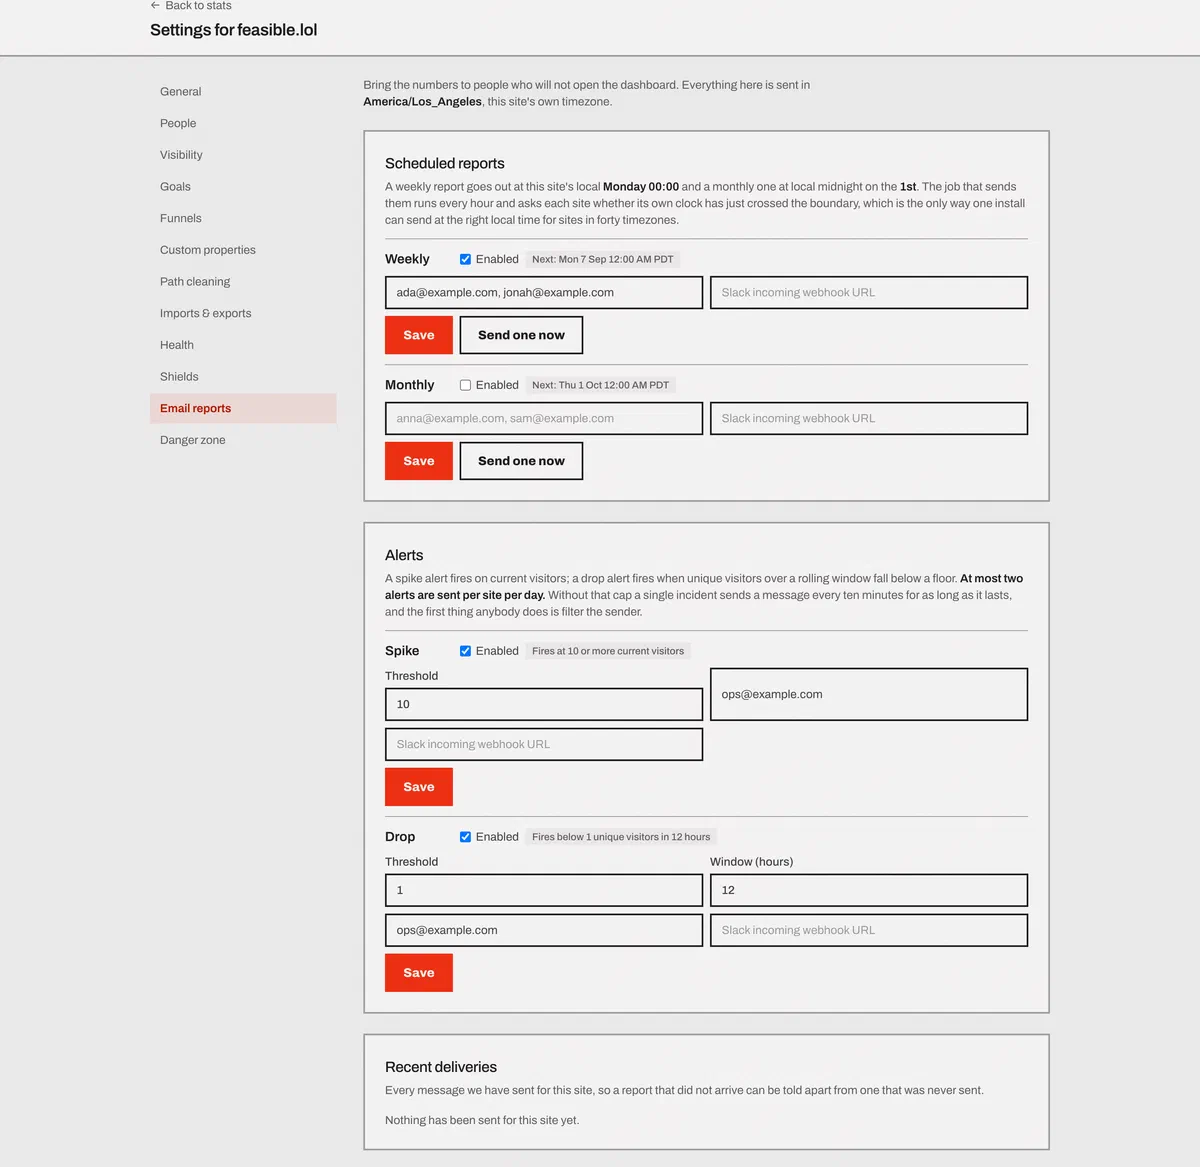
Schedule a report. Get an alert when traffic changes. Send either one by email, Slack, or both.
Reports on your schedule
A weekly report goes out at the site’s own local Monday 00:00. A monthly one at local midnight on the 1st.
That sounds like a detail and it’s the hard part. The job runs every hour and asks each site whether its own clock has just crossed the boundary, which is the only approach that works when one install serves sites in forty time zones - including the offsets that aren’t whole hours, and including the Sunday in March when one of those hours doesn’t exist.
Up to 25 recipients per report. They don’t need accounts; a report is something you send to your co-founder, your client, and the person who keeps asking how the blog is doing.
There’s a “send one now” button when you want to check what it looks like, and a delivery log of every message sent for the site - so a report that didn’t arrive can be told apart from a report that was never sent. Those two problems have completely different fixes and nobody should have to guess which one they have.
Recipients can take themselves off
A report goes to an address somebody else typed in. So every report and every
alert carries a one-click unsubscribe - the link in the footer, and the
List-Unsubscribe header that puts an Unsubscribe button in Gmail and Outlook
next to the sender’s name.
It needs no account and no password, and the link keeps working months later. The alternative is that people mark the mail as spam instead, which is worse for them and worse for us.
Times in every email follow the reader, not the sender. Set a 12-hour clock in
your own settings and your copy of the report says 3:04 PM while your
colleague’s says 15:04.
If the machine sending them was down, the scheduler looks back up to 32 days and sends what it missed rather than pretending the period didn’t happen.
Spike and drop alerts
Spike fires when current visitors cross a threshold. Default is 10. This is the fun one - you got linked somewhere, go look.
Drop fires when unique visitors over a rolling window fall below a floor. The default floor is 1, over a window you choose.
One is a lower bound than you’d expect, and that’s on purpose. The real question a drop alert answers isn’t “is traffic soft this week”. It’s “has my tracking stopped” - the deploy that dropped the script tag, the tag manager somebody reorganized, the CSP header that started blocking the endpoint. Set the floor at 1 and the alert means something unambiguous: nothing at all arrived, which is never right for a site that had traffic yesterday.
Alerts are evaluated every 10 minutes, and at most two go out per site per day. Without that cap, one incident sends a message every ten minutes for as long as it lasts, and the first thing anybody does is filter the sender - at which point the alert that would have saved you is in a folder you don’t read.
Slack
Every report and every alert takes a Slack incoming webhook alongside - or instead of - its email list. The URL is checked when you save it and again when it’s used, through a client that refuses to connect to internal addresses.
If you want something more than a message in a channel,
webhooks define traffic.spike and traffic.drop
as signed HTTP callbacks - though nothing publishes them yet, so email and Slack
are the two that work today.
Why only two alerts
Because the value of a scheduled email is inversely proportional to how many of them you get.
There’s no daily report, no digest, no “here’s an interesting anomaly we found”. Weekly and monthly are the two cadences people read, and adding a third would mostly train the recipient to archive on sight. The alert cap exists for the same reason: an alerting system’s real failure mode isn’t missing an incident, it’s being ignored during one.
The other reason is that the dashboard is one page and takes about four seconds to read. A tool that needs to email you a summary is usually a tool that’s too much work to open.
If nothing is arriving at all, the answer is probably on the data health panel rather than in an alert. Reports and alerts are configured per site in settings - see the docs or ask us.
The trade-off
Alerts are checked every 10 minutes and capped at two per site per day, so this is a heads-up, not a pager. Delivery is email or a Slack incoming webhook. There’s no SMS, push notification, or PagerDuty integration.